Necessities & Health Care – Where U.S. Consumers Spend Their MoneyConsumers spend most of their money on necessities, especially housing and health care. The brick-and-mortar retail industry is in crisis. For many old-line retailers, sales and market share are plunging fast.The reality is more mundane: We are spending a smaller portion of our budget at the mall, but the money we’re saving is mostly going for the most expensive health care in the universe.View Chart: Where The Money Goes: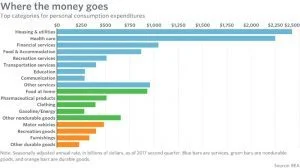 You might be shocked to learn that retail spending hit a record $1.4 trillion in the second quarter. Retail spending has increased in 30 of the past 33 quarters. We still love to buy stuff. The problem for retailers is that prices are falling for many retail goods such as clothing, electronics, appliances, furniture, tools, luggage, toys and many other things.This trend is killing the bottom line for traditional retailers, who get less revenue per unit sale but still have to pay the fixed costs of rent and payroll.It would be great if we really could afford to shift our spending from the boring things we need to the fun things we want, but in reality most of the money we are saving due to cheaper clothes and cheaper gasoline is going for goods and services that no one would call fun: hospital bills, financial services, rent, and prescription drugs.$1 Trillion A Month Spent on Personal ConsumptionAn incredible amount of money is spent on personal consumption — more than $1 trillion every month. A little less than half is spent on stuff at retail stores, and much of the rest is spent on housing, health care, financial services, education, communication and other services.View Chart: Growing Share of Spending
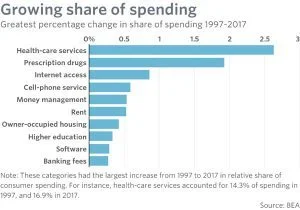 These numbers don’t lie … Americans are spending a much bigger portion of their budget on health-care services and prescription drugs. Since 1997, Americans have shifted a significant portion of their spending from physical things like autos, clothing and petroleum to services like health care, rent and internet access.Based on the following chart below, groceries, landline-phone service and clothing take a much smaller share of consumers’ budgets than they did 20 years ago. Conversely, spending on health-care services was 14.5% of consumer spending in 1997 but has grown to 16.9% today.Prescription drugs have gone from 1.5% of spending to 3.4% – with the price tag on prescription drugs has risen by an incredible $374 billion.View Chart: Falling Share of Spending Chart
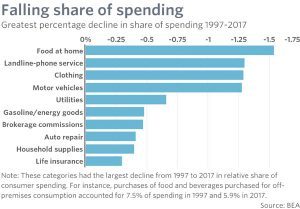 Who knew in 1997 that health care would be at the top of our expenditure list? According to the Bureau of Economic Analysis, Americans are spending a little bit more on having fun than we did 20 years ago, but most of our money still goes for necessities – health care at the top – not fun stuff.To learn more about this your healthcare options, contact TelePayroll at: 800-9772976 or send us an email.Source: MarketWatch – 8-23-17
Steven
Related posts
Onboarding Isn’t Paperwork—It’s a Launchpad for Growth
December 29, 2025Why Leadership Training Is the #1 Growth Differentiator
December 23, 2025
TOP HR Issues to Watch in 2014
December 10, 20134 Ways to Control Employee Chaos
October 3, 2019How to Deal with Absenteeism
August 28, 2019